Math Help! Function for growth/decay of a curve. Lua if possible : )

Hello Math Nerds!

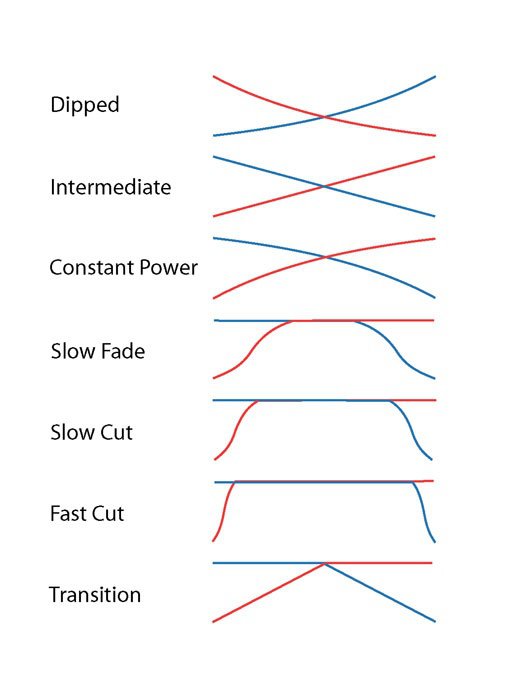
I am trying to write a bit of code in Lua to will help me achieve a certain type of curve (see below - ‘Constant Power’). I purchased some Grid controllers and I am wanting to setup one of the faders to do an constant power (equal power) crossfade between two values. Grid uses Lua for programming. Using some functions that the developer created, I can easily do a linear crossfade between two values with a simple bit of code. My next step is to do a constant power crossfade.

I’m stuck though :frowning: I don’t know how to express growth or decay to represent the constant power curve below. I only to work it out for one direction as I can invert the results to produce the other curve (at least I think I can):

My problem is that I only ‘technically’ have a Grade 9 education. I never got to algebra. I understand what I want to do but I don’t know how to frame my questions as a Google search so I can try and find the answers myself.

Could anyone assist with this? I would need to know a formula to express the growth and decay of those curves. The range for this particular element would be 0-127. I could make the adjustments for 14-bit controllers if I needed to. I just need some help with the math bits.

This doesn’t need to be Lua-specific either. It just so happens that I am working in Lua.

Big, big thanks in advance!

Edit: I’m also not a programmer. I’ve done some basic Python, PHP, Perl, BASH tutorials so I know some very basic fundamentals. However, if some of my replies seem a little…obtuse, it’s because I don’t have a programming or mathematics background.

The code (copied from Grid editor):

local num, min, max, v1, v2 = self:element_index(), self:potmeter_min(0), self:potmeter_max(127), self:potmeter_value(), self:potmeter_max() - self:potmeter_value()

local val_1, val_2 = v1 code for curve, v2 code for inverse <= code bits that I want to manipulate v1 and v2 to output growth/decay at a specific rate and assign to val_1 and val_2 to be transmitted with the midi() function

midi_send(11, 176, 74, val_1)

midi_send(11, 176, 73, val_2)


With that one line of code, it works perfectly as a linear crossfade. But linear does me no good for ‘transition trick’ style crossfades. Hence the need to figure out how to do those curves.

The second ‘local’ declaration is because I can’t reference variables that I am, at the same time, declaring. I’ve tested this. I need the second declaration to manipulate the variables in the first declaration. Just explaining the logic.

1 Like

You don’t need high grade math to do that.

You need to be able to recognize the look of the curve which are displayed.

  • dipped look like a exponential curve. Which is y=x^z
    If you have a scientific calculator you will see that the curve will be something like a big V

  • constant power is more a logarithmic one.
    y=ln(x)
    So the more x grow the less y will grow.
    It’s the opposite of the exponential (math people will throw me stone for that but there is some truth behind that).
    Not flat, but you can see that as a bird form draw by a kids.
    Graphic logarithmic function in google and click image

  • transition is a bit like y=x or similar

I guess with that you can move a bit forward.
Try to use float and not integer at the beginning because you need to have sub decimal number to play with.
Then you can make it between 0-127 or 14 bit depending on your need easily.

1 Like

This part I discerned though the rate of that curve would not be straight up log as that would be far too steep. There would need to be a way to adjust that rate of change. I believe this would be the ‘base’ of the function? Log2, Log10 etc.?

1 Like

Pretty much math free method to describe any shape is to create a table of points and for intermediates increment the difference between two adjacent point any interval you want. This is simple and quick to create.

Where that doesn’t work perfectly is for impulse changes. You can do that other ways.

1 Like

Maybe try to use log2 or log10 and display the curve using a scientific calculator or similar tool.

You are free to not just use log2 or log10 but a combination of th.
You can play with them and that’s funny !
For example if log10 is too hard you can use : y=x+log10(x) to make it less flat :slight_smile:

This seems to detail it and visually represent it actually:

https://matcmath.org/textbooks/quantitativereasoning/logarithmic-growth/

f(t)=A ⋅ log(t)+B

That is the function given. I’m not sure what operand the ⋅ represents here though. I suppose I need to re-frame the issue as well. The function isn’t to generate a log plot. It is to take a given value, derived from the fader position through self:potmeter_value(), and scale the output to represent a log curve. I know, and can set, the min and max values as ‘0’ and ‘127’. So, for each value returned from self:potmeter_value(), I need a formula to scale it accordingly (if I’m wording that correctly).

I guess it’s a multiply here.

The function isn’t to generate a log plot.

I understand, but drawing it, or printing the value is a way to see faster what you will get. And if it look to match your need.

1 Like

This might do it. I think I wasn’t getting output because I wasn’t using the Lua function, math.log() correctly. Your formula might yield results though :slight_smile:

To translate to my code snippet, I think this should yield useful results:

val_1 = v1+math.log10(v1)

1 Like

Bezier equation is easy to implement, and can be implemented with multiplies snd adds. Again you could use a table of data. Curve fitting to create the bezier curve data could from a graphics program, though there are other ways.

1 Like

This is covered pretty thoroughly here, although of course some math symbols appear very near the top! Still, I bet you can get there. This link: https://dsp.stackexchange.com/q/14754

From a coding or a general perspective, try to think of what you are doing as operating on values from 0 to 1 only until the very end, when you scale up to 0 to 127.

1 Like

I was considering this approach as there are only 127 pairs that I’d need to store. I’m hoping to achieve without a fixed table though as I also have some other things that I’d like to solve like adding breaks points to delay the onset of curve. Not necessarily applicable for my needs but I’d love to sort it out to share with other Grid users.

You don’t need data pairs if your x interval is fixed, you just need the y values.

Obviously this creates a series of line segments, but enough points, shortens the line segments to be very close to a curve. Most often this is not a problem, assuming you’re not trying to land on the moon.

Another easy way to move this one point up and down, again data driven is to create a very very simple instruction set. Instruction, data. Data can be one number or many depending on the instruction. This is fun to create very simple interpreted languages with just a handful of instructions. I’ll leave the detail to the imagination on this.

Easiest if no jumps or conditionals. Just what and how many of the points follow, etc. Generating these program tables from raw data, is very easy too.

Nope. Just trying to out MIDI CC values from 0-127, scaled logarithmically, based on fader position.

Though now I need to also accommodate for the fact that I can only output non-decimal values. So, it would need to be something like this:

Fader Position | Scaled Output Value
127 <=> 127
126 <=> 126
125 <=> 126
124 <=> 126
123 <=> …
122 <=> …
121 <=> …
120 <=> …
… <=> …
14 <=> …
13 <=> …
12 <=> …
11 <=> …
10 <=> …
9 <=> 2
8 <=> 2
7 <=> 1
6 <=> 1
5 <=> 1
4 <=> 1
3 <=> 0
2 <=> 0
1 <=> 0
0 <=> 0

Just gave this a read. While what is being said makes absolute sense, I’m not sure how I would translate it to my example. It would be a matter of translating that formula into Lua. I would need to read up on Lua a bit better to see how I would code those expressions.

I think this achieves what I am looking to do.

I think you can do this. Don’t let your educational background hold you back. You are creative, so that will allow you to work through this.

One of the smartest hw sw guys i ever knew had less education than you, and practically no mathematics.

2 Likes

Much appreciated! I’m sure there’s a solution here. I just looked at @ptomaselli’s link. That appears to be the math I would use by unsure how to express it in Lua or apply it to my problem.

I’m putting my thinking cap down for the evening. I think there’s enough direction here to get me digging/poking around more tomorrow. I just need to step back and re-frame the problem to myself so I can search out the correct solution. @ptomaselli’s link provides the maths I believe. Just need to apply it to my problem.

The helps/feedback’s been greatly appreciated! :smiley:

This could just be a look up table – aka array. There are only 128 bytes for each table, and you had 7 tables. Obviously you can reverse and invert the tables easily. If you want average between two tables will give you intermediate tables. Does that work for you ?

Yup. One condition (that I can think of):

  • The table/array (data structure) would need to represent two values, both maintaining equal power across the range for a given pair.

That square root-based formula that was linked is the likely solution though the values can only be non-decimal numbers (integers?) represented within the range (0-127)